機械学習のお勉強(次元削減)
教科書
特徴抽出
特徴抽出ではデータを新しい特徴空間に射影する
主成分分析(PCA)
線形判別分離(LDA)
カーネル主成分分析
などがある。
主成分分析による次元削減

d次元のデータセットを標準化する
標準化したデータセットの共分散行列を作成する
上位k個の固有ベクトルから射影行列Wを作成する
射影行列Wを使ってd次元の入力データセットXを変換し、新しいk次元の特徴部分空間を取得する
共分散行列の固有値
- 標準化
import pandas as pd

df_wine = pd.read_csv('https://archive.ics.uci.edu/ml/'
                      'machine-learning-databases/wine/wine.data',
                      header=None)

df_wine.columns = ['Class label', 'Alcohol', 'Malic acid', 'Ash',
                   'Alcalinity of ash', 'Magnesium', 'Total phenols',
                   'Flavanoids', 'Nonflavanoid phenols', 'Proanthocyanins',
                   'Color intensity', 'Hue',
                   'OD280/OD315 of diluted wines', 'Proline']

df_wine.head()

if Version(sklearn_version) < '0.18':
    from sklearn.cross_validation import train_test_split
else:
    from sklearn.model_selection import train_test_split

X, y = df_wine.iloc[:, 1:].values, df_wine.iloc[:, 0].values

X_train, X_test, y_train, y_test = \
    train_test_split(X, y, test_size=0.3, random_state=0)

from sklearn.preprocessing import StandardScaler

sc = StandardScaler()
X_train_std = sc.fit_transform(X_train)
X_test_std = sc.transform(X_test)
import numpy as np
cov_mat = np.cov(X_train_std.T)
eigen_vals, eigen_vecs = np.linalg.eig(cov_mat)

print('\nEigenvalues \n%s' % eigen_vals)
固有値の分散説明率
固有値 : lambda

分散説明率 : lambda_j / sum(lambda)
実装
tot = sum(eigen_vals)
var_exp = [(i / tot) for i in sorted(eigen_vals, reverse=True)]
cum_var_exp = np.cumsum(var_exp)

import matplotlib.pyplot as plt


plt.bar(range(1, 14), var_exp, alpha=0.5, align='center',
        label='individual explained variance')
plt.step(range(1, 14), cum_var_exp, where='mid',
         label='cumulative explained variance')
plt.ylabel('Explained variance ratio')
plt.xlabel('Principal components')
plt.legend(loc='best')
plt.tight_layout()
# plt.savefig('./figures/pca1.png', dpi=300)
plt.show()
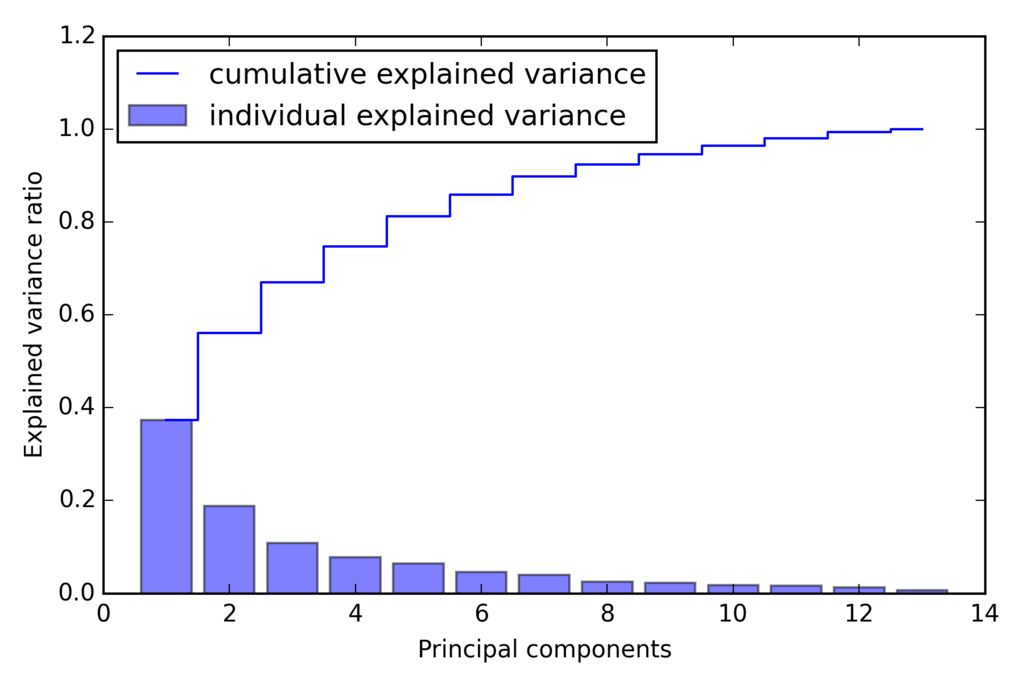
最初の2つの主成分で分散の60%近くになることがわかる。
ランダムフォレストのクラスラベルの重要度と似ているが、こちらはラベルを使わずデータ散らばり具合を利用して導出される。
特徴変換
4 . 固有値の大きいものから並べ替え
# Make a list of (eigenvalue, eigenvector) tuples
eigen_pairs = [(np.abs(eigen_vals[i]), eigen_vecs[:, i])
               for i in range(len(eigen_vals))]

# Sort the (eigenvalue, eigenvector) tuples from high to low
eigen_pairs.sort(key=lambda k: k[0], reverse=True)

# Note: I added the `key=lambda k: k[0]` in the sort call above
# just like I used it further below in the LDA section.
# This is to avoid problems if there are ties in the eigenvalue
# arrays (i.e., the sorting algorithm will only regard the
# first element of the tuples, now).
w = np.hstack((eigen_pairs[0][1][:, np.newaxis],
               eigen_pairs[1][1][:, np.newaxis]))
print('Matrix W:\n', w)
この13x2次元の射影行列Wを用いて、2次元のサンプルベクトルx'を生成できる。
print X_train_std[0].dot(w)
# array([ 2.59891628,  0.00484089])
6 . トレーニングデータセットを2次元の散布図としてプロット
X_train_pca = X_train_std.dot(w)
colors = ['r', 'b', 'g']
markers = ['s', 'x', 'o']

for l, c, m in zip(np.unique(y_train), colors, markers):
    plt.scatter(X_train_pca[y_train == l, 0],
                X_train_pca[y_train == l, 1],
                c=c, label=l, marker=m)

plt.xlabel('PC 1')
plt.ylabel('PC 2')
plt.legend(loc='lower left')
plt.tight_layout()
# plt.savefig('./figures/pca2.png', dpi=300)
plt.show()

scikit-learnで主成分分析
from sklearn.decomposition import PCA

pca = PCA()
X_train_pca = pca.fit_transform(X_train_std)
pca.explained_variance_ratio_
上位2つに対してPCA
pca = PCA(n_components=2)
X_train_pca = pca.fit_transform(X_train_std)
X_test_pca = pca.transform(X_test_std)
ロジスティック回帰実施
from sklearn.linear_model import LogisticRegression

lr = LogisticRegression()
lr = lr.fit(X_train_pca, y_train)
train結果

test結果

この結果からロジスティック回帰の性能が良いことがわかる
また、すべての主成分の分散説明率を知りたい場合、n_components=Noneを設定して初期化する。
pca = PCA(n_components=None)
X_train_pca = pca.fit_transform(X_train_std)
pca.explained_variance_ratio_
線形判別分析によるデータ圧縮
計算効率を高め、正規化されていないモデルで次元の呪いによる過学習を抑制することができる
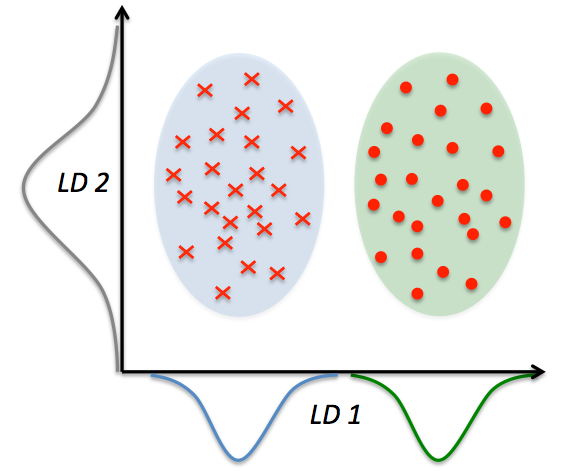
クラスの分離を最適化する特徴部分空間を見つけ出す
d次元のデータセットを標準化する
クラス毎にd次元の平均ベクトルを計算する
クラス間変動行列Sbとクラス内変動行列Swを生成する
dxk次元の変換行列Wを生成するためにもっとも大きいk個の固有値に対応するk個の固有ベクトルを選択する。(固有ベクトルは行列の列)
変換行列Wを使ってサンプルを新しい特徴部分空間へ射影する
変動行列を計算
2 . 平均ベクトル
np.set_printoptions(precision=4)

mean_vecs = []
for label in range(1, 4):
    mean_vecs.append(np.mean(X_train_std[y_train == label], axis=0))
    print('MV %s: %s\n' % (label, mean_vecs[label - 1]))
3 . クラス内変動行列
d = 13  # number of features
S_W = np.zeros((d, d))
for label, mv in zip(range(1, 4), mean_vecs):
    class_scatter = np.zeros((d, d))  # scatter matrix for each class
    for row in X_train_std[y_train == label]:
        row, mv = row.reshape(d, 1), mv.reshape(d, 1)  # make column vectors
        class_scatter += (row - mv).dot((row - mv).T)
    S_W += class_scatter                          # sum class scatter matrices

print('Within-class scatter matrix: %sx%s' % (S_W.shape[0], S_W.shape[1]))
# Within-class scatter matrix: 13x13
上記を行うにはクラスラベルが一様に分布している必要がある
しかし、
print('Class label distribution: %s'
   % np.bincount(y_train)[1:])
# Class label distribution: [40 49 35]
満たしていないので、スケーリングが必要。スケーリング、サンプル数で割る、操作を行うと共分散行列と同じであることがわかる。
よって以下で表すことができる
d = 13  # number of features
S_W = np.zeros((d, d))
for label, mv in zip(range(1, 4), mean_vecs):
    class_scatter = np.cov(X_train_std[y_train == label].T)
    S_W += class_scatter
print('Scaled within-class scatter matrix: %sx%s' % (S_W.shape[0],
                                                     S_W.shape[1]))
3 . クラス間変動行列
mean_overall = np.mean(X_train_std, axis=0)
d = 13  # number of features
S_B = np.zeros((d, d))
for i, mean_vec in enumerate(mean_vecs):
    n = X_train[y_train == i + 1, :].shape[0]
    mean_vec = mean_vec.reshape(d, 1)  # make column vector
    mean_overall = mean_overall.reshape(d, 1)  # make column vector
    S_B += n * (mean_vec - mean_overall).dot((mean_vec - mean_overall).T)

print('Between-class scatter matrix: %sx%s' % (S_B.shape[0], S_B.shape[1]))
# Between-class scatter matrix: 13x13
新しい特徴部分空間の線形判別を選択
4 . 固有値問題を解く
eigen_vals, eigen_vecs = np.linalg.eig(np.linalg.inv(S_W).dot(S_B))
# Make a list of (eigenvalue, eigenvector) tuples
eigen_pairs = [(np.abs(eigen_vals[i]), eigen_vecs[:, i])
               for i in range(len(eigen_vals))]

# Sort the (eigenvalue, eigenvector) tuples from high to low
eigen_pairs = sorted(eigen_pairs, key=lambda k: k[0], reverse=True)

# Visually confirm that the list is correctly sorted by decreasing eigenvalues

print('Eigenvalues in decreasing order:\n')
for eigen_val in eigen_pairs:
    print(eigen_val[0])
結果
Eigenvalues in decreasing order:

452.721581245
156.43636122
3.59696053827e-14
3.50722067103e-14
3.50722067103e-14
2.84217094304e-14
2.46524103582e-14
2.46524103582e-14
2.18345154287e-14
2.18345154287e-14
1.69066127548e-14
1.39492602566e-15
1.39492602566e-15
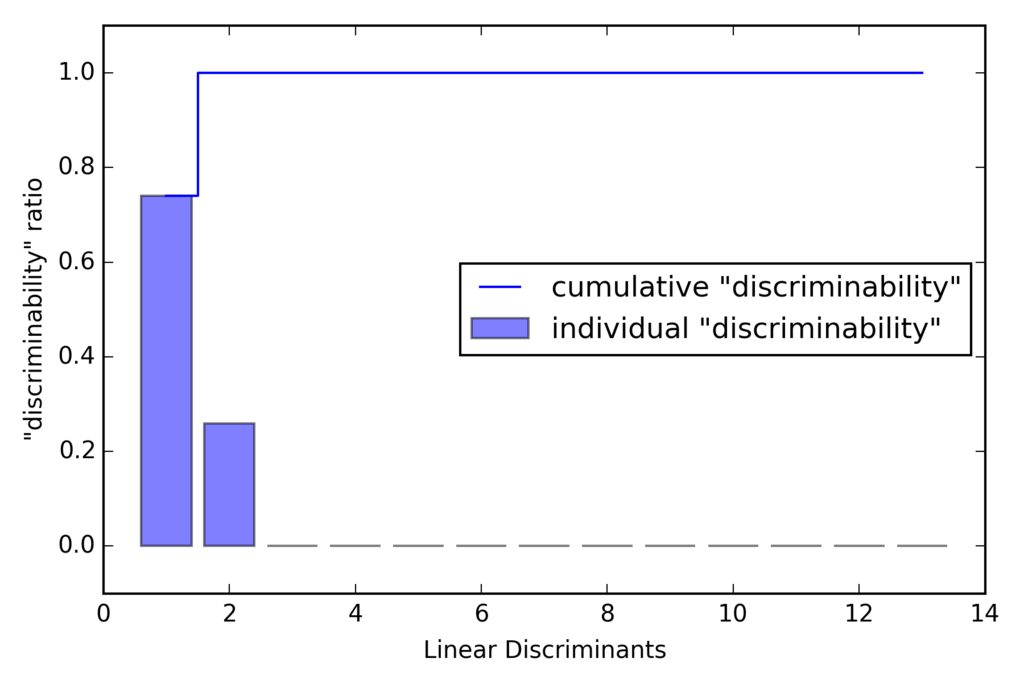
上記からわかる通り、LDAでの線形判別の個数は最大で(クラス数-1)個となる。
TODO:なぜLDAでの線形判別の個数は最大で(クラス数-1)個となるのか調べる。。。わかる方教えてください笑
線形判別のプロット
tot = sum(eigen_vals.real)
discr = [(i / tot) for i in sorted(eigen_vals.real, reverse=True)]
cum_discr = np.cumsum(discr)

plt.bar(range(1, 14), discr, alpha=0.5, align='center',
        label='individual "discriminability"')
plt.step(range(1, 14), cum_discr, where='mid',
         label='cumulative "discriminability"')
plt.ylabel('"discriminability" ratio')
plt.xlabel('Linear Discriminants')
plt.ylim([-0.1, 1.1])
plt.legend(loc='best')
plt.tight_layout()
# plt.savefig('./figures/lda1.png', dpi=300)
plt.show()
5 . 変換行列の作成
w = np.hstack((eigen_pairs[0][1][:, np.newaxis].real,
              eigen_pairs[1][1][:, np.newaxis].real))
print('Matrix W:\n', w)
結果
w = np.hstack((eigen_pairs[0][1][:, np.newaxis].real,
              eigen_pairs[1][1][:, np.newaxis].real))
print('Matrix W:\n', w)
w = np.hstack((eigen_pairs[0][1][:, np.newaxis].real,
              eigen_pairs[1][1][:, np.newaxis].real))
print('Matrix W:\n', w)
Matrix W:
 [[-0.0662 -0.3797]
 [ 0.0386 -0.2206]
 [-0.0217 -0.3816]
 [ 0.184   0.3018]
 [-0.0034  0.0141]
 [ 0.2326  0.0234]
 [-0.7747  0.1869]
 [-0.0811  0.0696]
 [ 0.0875  0.1796]
 [ 0.185  -0.284 ]
 [-0.066   0.2349]
 [-0.3805  0.073 ]
 [-0.3285 -0.5971]]
新しい特徴空間にサンプルを射影
- トレーニングデータセットの変換
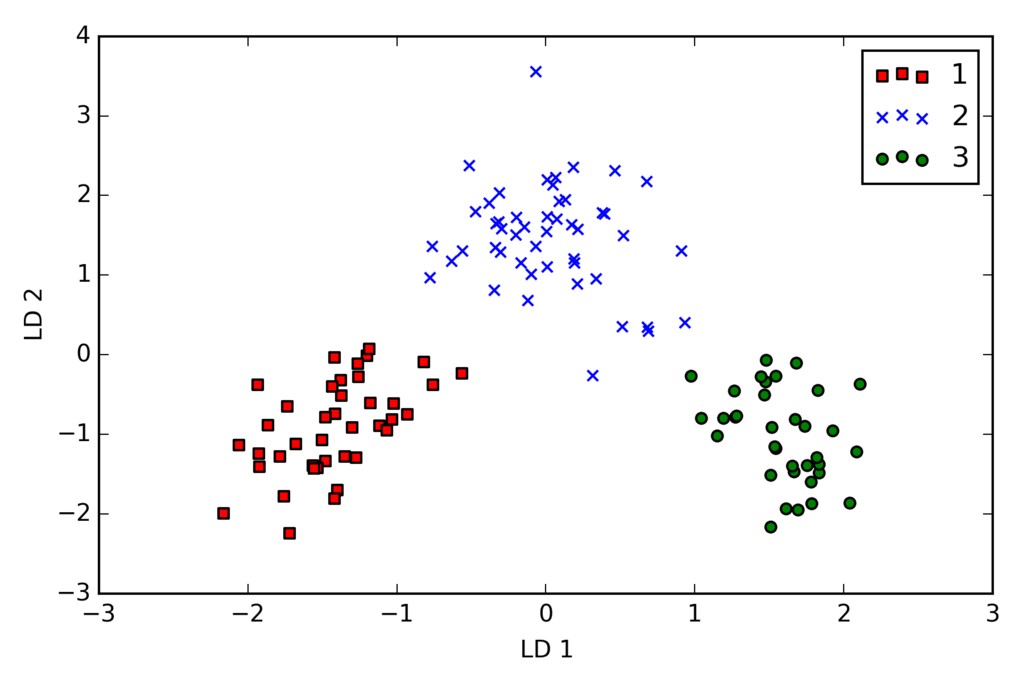
X_train_lda = X_train_std.dot(w)
colors = ['r', 'b', 'g']
markers = ['s', 'x', 'o']

for l, c, m in zip(np.unique(y_train), colors, markers):
    plt.scatter(X_train_lda[y_train == l, 0] * (-1),
                X_train_lda[y_train == l, 1] * (-1),
                c=c, label=l, marker=m)

plt.xlabel('LD 1')
plt.ylabel('LD 2')
plt.legend(loc='lower right')
plt.tight_layout()
# plt.savefig('./figures/lda2.png', dpi=300)
plt.show()
scikit-learnによるLDA
if Version(sklearn_version) < '0.18':
    from sklearn.lda import LDA
else:
    from sklearn.discriminant_analysis import LinearDiscriminantAnalysis as LDA

lda = LDA(n_components=2)
X_train_lda = lda.fit_transform(X_train_std, y_train)
ロジスティック回帰でトレーニング
from sklearn.linear_model import LogisticRegression
lr = LogisticRegression()
lr = lr.fit(X_train_lda, y_train)

plot_decision_regions(X_train_lda, y_train, classifier=lr)
plt.xlabel('LD 1')
plt.ylabel('LD 2')
plt.legend(loc='lower left')
plt.tight_layout()
# plt.savefig('./images/lda3.png', dpi=300)
plt.show()

テストデータ分類
X_test_lda = lda.transform(X_test_std)

plot_decision_regions(X_test_lda, y_test, classifier=lr)
plt.xlabel('LD 1')
plt.ylabel('LD 2')
plt.legend(loc='lower left')
plt.tight_layout()
# plt.savefig('./images/lda4.png', dpi=300)
plt.show()

2次元の特徴部分空間だけを用いてすべて正しく分類できている
カーネル主成分分析を使った非線形写像
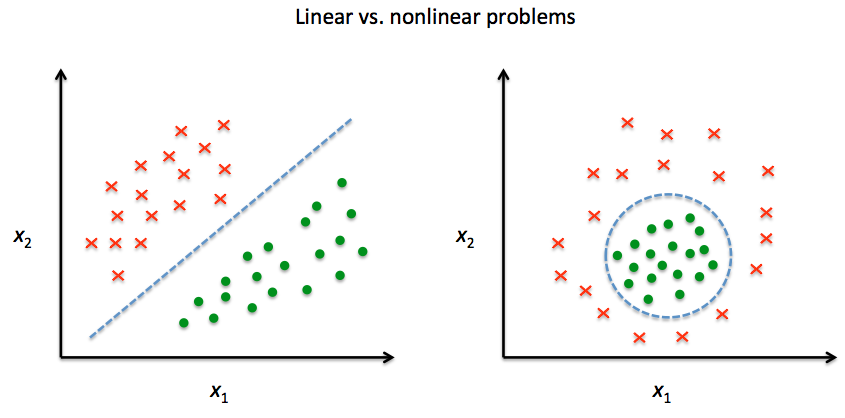
線形に分離できないデータを変換し、線形分類器に適した新しい低次元の部分空間へ射影する
カーネル関数とカーネルトリック
双曲線正接カーネル:サポートベクターマシンとは[カーネル法による非線形サポートベクターマシン] - verum ipsum factum
動径基底関数、ガウスカーネル:放射基底関数(Radial basis function, RBF) - 大人になってからの再学習
カーネル行列を計算 : K(xi, xj) = exp(-gamma * ||x_i - x_j ||**2)
カーネル行列の中心化
実装
from scipy.spatial.distance import pdist, squareform
from scipy import exp
from numpy.linalg import eigh
import numpy as np

def rbf_kernel_pca(X, gamma, n_components):
    """
    RBF kernel PCA implementation.

    Parameters
    ------------
    X: {NumPy ndarray}, shape = [n_samples, n_features]

    gamma: float
      Tuning parameter of the RBF kernel

    n_components: int
      Number of principal components to return

    Returns
    ------------
     X_pc: {NumPy ndarray}, shape = [n_samples, k_features]
       Projected dataset

    """
    # Calculate pairwise squared Euclidean distances
    # in the MxN dimensional dataset.
    sq_dists = pdist(X, 'sqeuclidean')

    # Convert pairwise distances into a square matrix.
    mat_sq_dists = squareform(sq_dists)

    # Compute the symmetric kernel matrix.
    K = exp(-gamma * mat_sq_dists)

    # Center the kernel matrix.
    N = K.shape[0]
    one_n = np.ones((N, N)) / N
    K = K - one_n.dot(K) - K.dot(one_n) + one_n.dot(K).dot(one_n)

    # Obtaining eigenpairs from the centered kernel matrix
    # numpy.linalg.eigh returns them in sorted order
    eigvals, eigvecs = eigh(K)

    # Collect the top k eigenvectors (projected samples)
    X_pc = np.column_stack((eigvecs[:, -i]
                            for i in range(1, n_components + 1)))

    return X_pc
半月型の分離
import matplotlib.pyplot as plt
from sklearn.datasets import make_moons

X, y = make_moons(n_samples=100, random_state=123)

plt.scatter(X[y == 0, 0], X[y == 0, 1], color='red', marker='^', alpha=0.5)
plt.scatter(X[y == 1, 0], X[y == 1, 1], color='blue', marker='o', alpha=0.5)

plt.tight_layout()
# plt.savefig('./figures/half_moon_1.png', dpi=300)
plt.show()

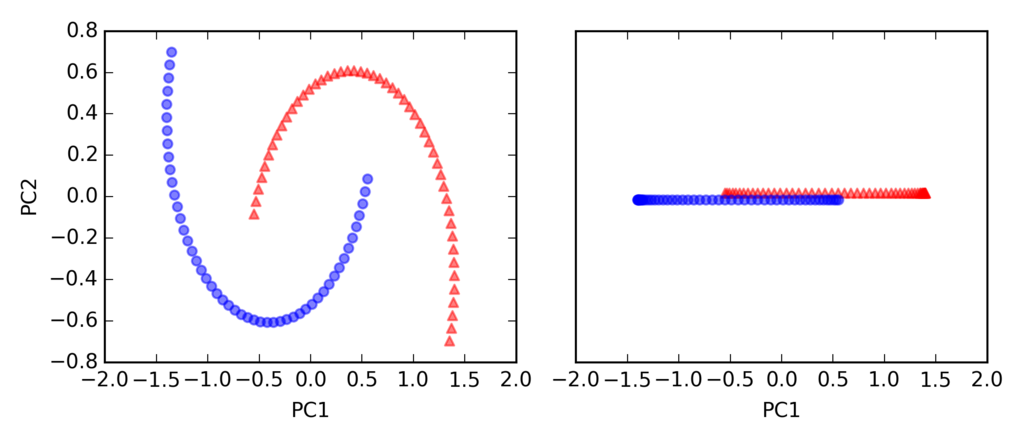
標準のPCA
from sklearn.decomposition import PCA
from sklearn.preprocessing import StandardScaler

scikit_pca = PCA(n_components=2)
X_spca = scikit_pca.fit_transform(X)

fig, ax = plt.subplots(nrows=1, ncols=2, figsize=(7, 3))

ax[0].scatter(X_spca[y == 0, 0], X_spca[y == 0, 1],
              color='red', marker='^', alpha=0.5)
ax[0].scatter(X_spca[y == 1, 0], X_spca[y == 1, 1],
              color='blue', marker='o', alpha=0.5)

ax[1].scatter(X_spca[y == 0, 0], np.zeros((50, 1)) + 0.02,
              color='red', marker='^', alpha=0.5)
ax[1].scatter(X_spca[y == 1, 0], np.zeros((50, 1)) - 0.02,
              color='blue', marker='o', alpha=0.5)

ax[0].set_xlabel('PC1')
ax[0].set_ylabel('PC2')
ax[1].set_ylim([-1, 1])
ax[1].set_yticks([])
ax[1].set_xlabel('PC1')

plt.tight_layout()
# plt.savefig('./figures/half_moon_2.png', dpi=300)
plt.show()
カーネルPCA
from matplotlib.ticker import FormatStrFormatter

X_kpca = rbf_kernel_pca(X, gamma=15, n_components=2)

fig, ax = plt.subplots(nrows=1,ncols=2, figsize=(7,3))
ax[0].scatter(X_kpca[y==0, 0], X_kpca[y==0, 1],
            color='red', marker='^', alpha=0.5)
ax[0].scatter(X_kpca[y==1, 0], X_kpca[y==1, 1],
            color='blue', marker='o', alpha=0.5)

ax[1].scatter(X_kpca[y==0, 0], np.zeros((50,1))+0.02,
            color='red', marker='^', alpha=0.5)
ax[1].scatter(X_kpca[y==1, 0], np.zeros((50,1))-0.02,
            color='blue', marker='o', alpha=0.5)

ax[0].set_xlabel('PC1')
ax[0].set_ylabel('PC2')
ax[1].set_ylim([-1, 1])
ax[1].set_yticks([])
ax[1].set_xlabel('PC1')
ax[0].xaxis.set_major_formatter(FormatStrFormatter('%0.1f'))
ax[1].xaxis.set_major_formatter(FormatStrFormatter('%0.1f'))

plt.tight_layout()
# plt.savefig('./figures/half_moon_3.png', dpi=300)
plt.show()

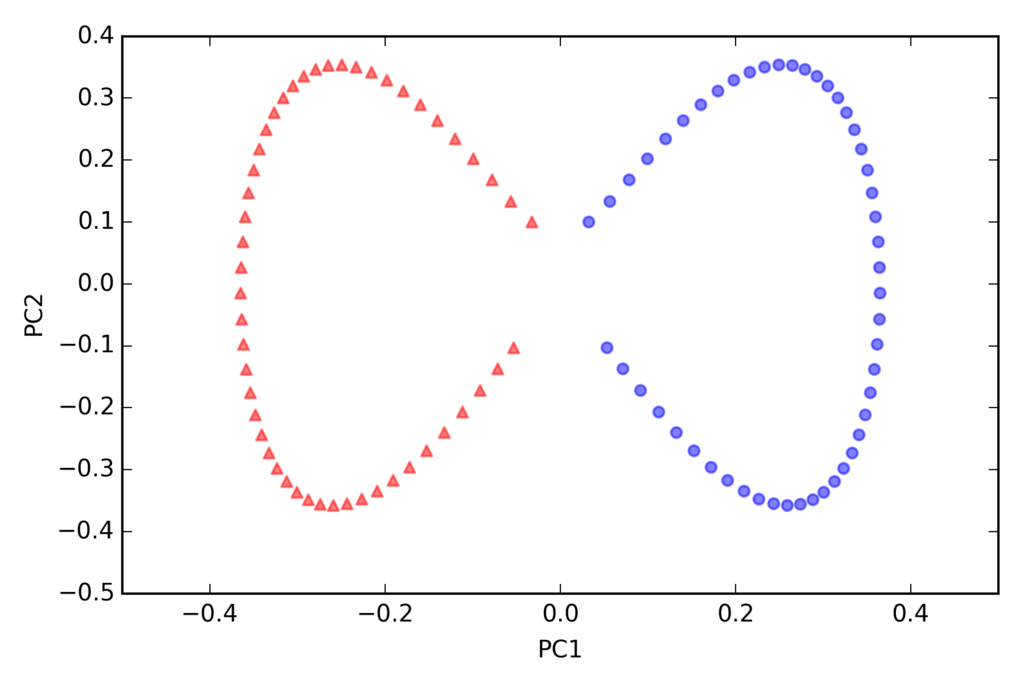
rbf_kernel_pca(X, gamma=15, n_components=2)のgammaはチューニングパラメータで適切な値を設定する必要がある
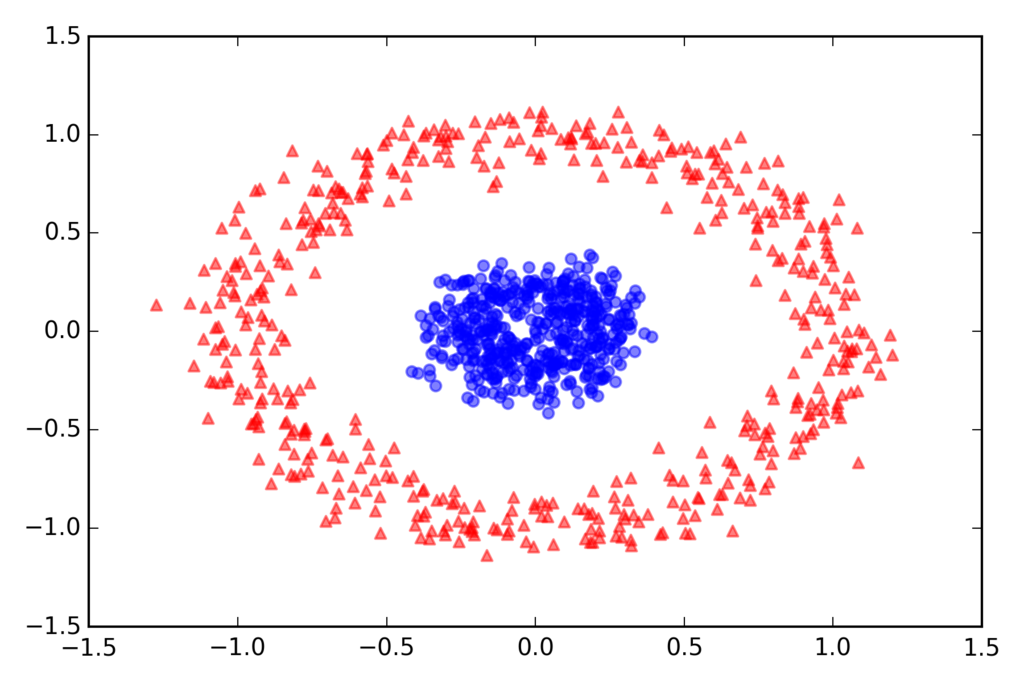
同心円の分離
from sklearn.datasets import make_circles

X, y = make_circles(n_samples=1000, random_state=123, noise=0.1, factor=0.2)

plt.scatter(X[y == 0, 0], X[y == 0, 1], color='red', marker='^', alpha=0.5)
plt.scatter(X[y == 1, 0], X[y == 1, 1], color='blue', marker='o', alpha=0.5)

plt.tight_layout()
# plt.savefig('./figures/circles_1.png', dpi=300)
plt.show()
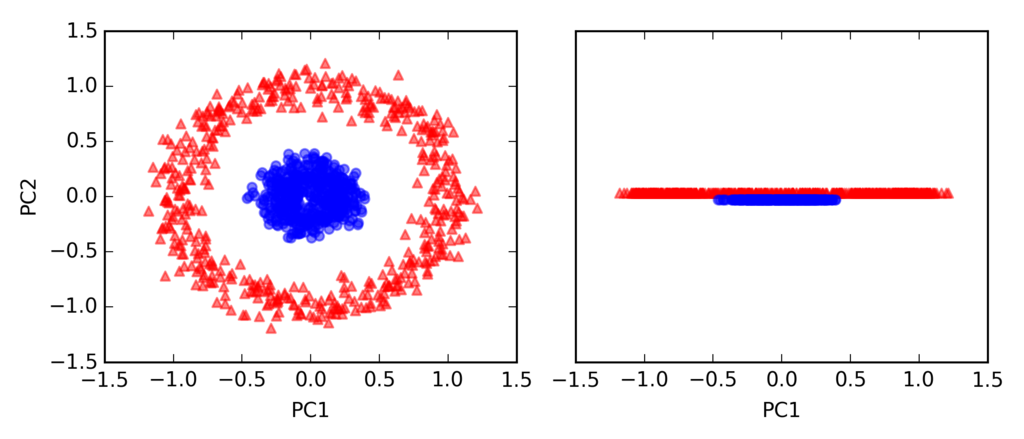
標準のPCA
scikit_pca = PCA(n_components=2)
X_spca = scikit_pca.fit_transform(X)

fig, ax = plt.subplots(nrows=1, ncols=2, figsize=(7, 3))

ax[0].scatter(X_spca[y == 0, 0], X_spca[y == 0, 1],
              color='red', marker='^', alpha=0.5)
ax[0].scatter(X_spca[y == 1, 0], X_spca[y == 1, 1],
              color='blue', marker='o', alpha=0.5)

ax[1].scatter(X_spca[y == 0, 0], np.zeros((500, 1)) + 0.02,
              color='red', marker='^', alpha=0.5)
ax[1].scatter(X_spca[y == 1, 0], np.zeros((500, 1)) - 0.02,
              color='blue', marker='o', alpha=0.5)

ax[0].set_xlabel('PC1')
ax[0].set_ylabel('PC2')
ax[1].set_ylim([-1, 1])
ax[1].set_yticks([])
ax[1].set_xlabel('PC1')

plt.tight_layout()
# plt.savefig('./figures/circles_2.png', dpi=300)
plt.show()
カーネルPCA
X_kpca = rbf_kernel_pca(X, gamma=15, n_components=2)

fig, ax = plt.subplots(nrows=1, ncols=2, figsize=(7, 3))
ax[0].scatter(X_kpca[y == 0, 0], X_kpca[y == 0, 1],
              color='red', marker='^', alpha=0.5)
ax[0].scatter(X_kpca[y == 1, 0], X_kpca[y == 1, 1],
              color='blue', marker='o', alpha=0.5)

ax[1].scatter(X_kpca[y == 0, 0], np.zeros((500, 1)) + 0.02,
              color='red', marker='^', alpha=0.5)
ax[1].scatter(X_kpca[y == 1, 0], np.zeros((500, 1)) - 0.02,
              color='blue', marker='o', alpha=0.5)

ax[0].set_xlabel('PC1')
ax[0].set_ylabel('PC2')
ax[1].set_ylim([-1, 1])
ax[1].set_yticks([])
ax[1].set_xlabel('PC1')

plt.tight_layout()
# plt.savefig('./figures/circles_3.png', dpi=300)
plt.show()

新しいデータ点の射影
from scipy.spatial.distance import pdist, squareform
from scipy import exp
from scipy.linalg import eigh
import numpy as np

def rbf_kernel_pca(X, gamma, n_components):
    """
    RBF kernel PCA implementation.

    Parameters
    ------------
    X: {NumPy ndarray}, shape = [n_samples, n_features]

    gamma: float
      Tuning parameter of the RBF kernel

    n_components: int
      Number of principal components to return

    Returns
    ------------
     X_pc: {NumPy ndarray}, shape = [n_samples, k_features]
       Projected dataset

     lambdas: list
       Eigenvalues

    """
    # Calculate pairwise squared Euclidean distances
    # in the MxN dimensional dataset.
    sq_dists = pdist(X, 'sqeuclidean')

    # Convert pairwise distances into a square matrix.
    mat_sq_dists = squareform(sq_dists)

    # Compute the symmetric kernel matrix.
    K = exp(-gamma * mat_sq_dists)

    # Center the kernel matrix.
    N = K.shape[0]
    one_n = np.ones((N, N)) / N
    K = K - one_n.dot(K) - K.dot(one_n) + one_n.dot(K).dot(one_n)

    # Obtaining eigenpairs from the centered kernel matrix
    # numpy.eigh returns them in sorted order
    eigvals, eigvecs = eigh(K)

    # Collect the top k eigenvectors (projected samples)
    alphas = np.column_stack((eigvecs[:, -i]
                              for i in range(1, n_components + 1)))

    # Collect the corresponding eigenvalues
    lambdas = [eigvals[-i] for i in range(1, n_components + 1)]

    return alphas, lambdas
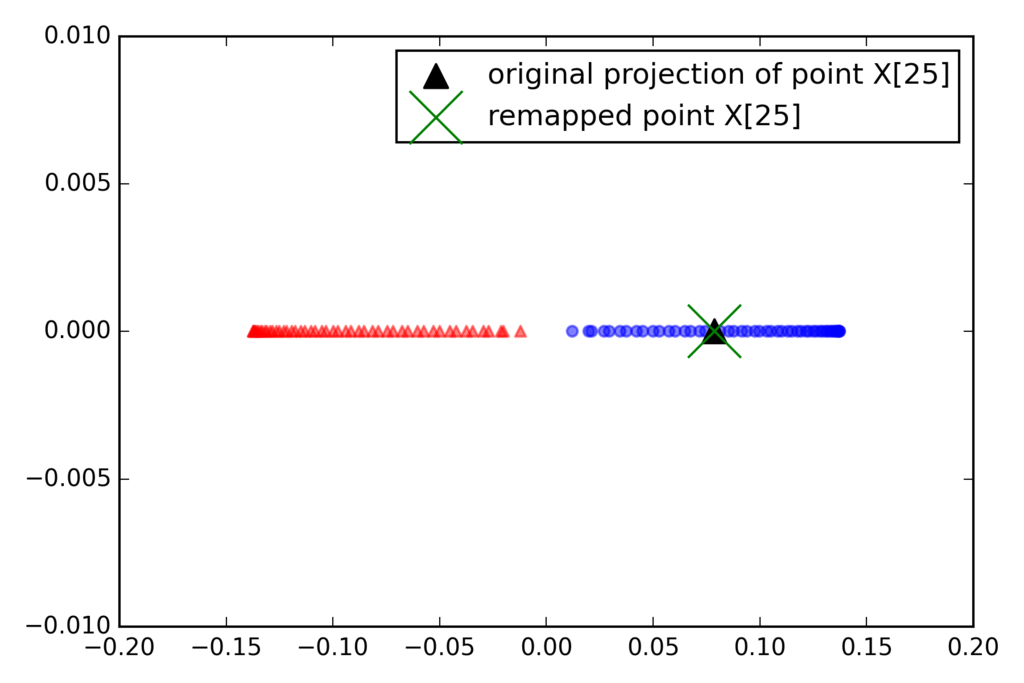
一次元の部分空間に射影
X, y = make_moons(n_samples=100, random_state=123)
alphas, lambdas = rbf_kernel_pca(X, gamma=15, n_components=1)

x_new = X[-1]
x_new

x_proj = alphas[-1] # original projection
x_proj

def project_x(x_new, X, gamma, alphas, lambdas):
    pair_dist = np.array([np.sum((x_new - row)**2) for row in X])
    k = np.exp(-gamma * pair_dist)
    return k.dot(alphas / lambdas)

# projection of the "new" datapoint
x_reproj = project_x(x_new, X, gamma=15, alphas=alphas, lambdas=lambdas)
x_reproj

plt.scatter(alphas[y == 0, 0], np.zeros((50)),
            color='red', marker='^', alpha=0.5)
plt.scatter(alphas[y == 1, 0], np.zeros((50)),
            color='blue', marker='o', [f:id:robonchu:20171016215610p:plain]alpha=0.5)
plt.scatter(x_proj, 0, color='black',
            label='original projection of point X[25]', marker='^', s=100)
plt.scatter(x_reproj, 0, color='green',
            label='remapped point X[25]', marker='x', s=500)
plt.legend(scatterpoints=1)

plt.tight_layout()
# plt.savefig('./figures/reproject.png', dpi=300)
plt.show()
scikit-learnのカーネルPCA
from sklearn.decomposition import KernelPCA

X, y = make_moons(n_samples=100, random_state=123)
scikit_kpca = KernelPCA(n_components=2, kernel='rbf', gamma=15)
X_skernpca = scikit_kpca.fit_transform(X)

plt.scatter(X_skernpca[y == 0, 0], X_skernpca[y == 0, 1],
            color='red', marker='^', alpha=0.5)
plt.scatter(X_skernpca[y == 1, 0], X_skernpca[y == 1, 1],
            color='blue', marker='o', alpha=0.5)

plt.xlabel('PC1')
plt.ylabel('PC2')
plt.tight_layout()
# plt.savefig('./figures/scikit_kpca.png', dpi=300)
plt.show()
