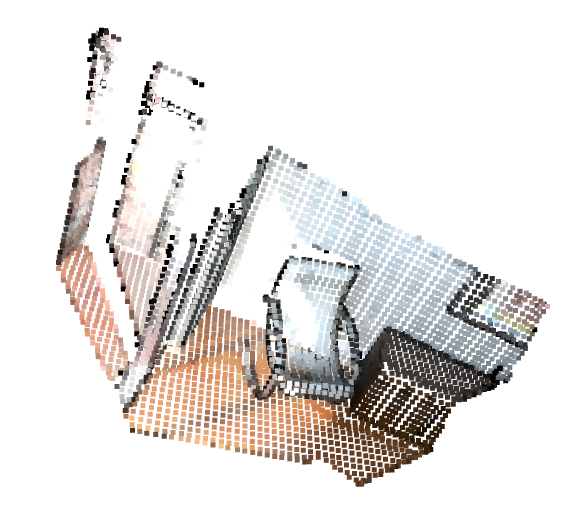
Open3Dのお勉強(一回目)
やりたいこと
Depthセンサで取得したデータをOpen3Dで自由自在に操りたい
Open3D – A Modern Library for 3D Data Processing

Open3Dまじでイケてる!
Intelさんありがとうございまぁぁす!!
教科書
Open3D: A Modern Library for 3D Data Processing — Open3D 0.9.0 documentation
インストール
以下、cmakeでpythonのバージョンが揃う指定している
scripts/install-deps-ubuntu.sh
mkdir build
cd build
cmake -DPYTHON_EXECUTABLE:FILEPATH=/usr/bin/python ../src
make -j
fatal error: Python.h: No such file or directory
が出たら、
make test works, but unable to run tests individually · Issue #234 · pybind/pybind11 · GitHub
ライブラリpy3dのテスト
- $Open3D/build/lib/Tutorial/Basic$ python rgbd_redwood.py
で

が出たらおけ
Getting Started
Redwood dataset
大事↓
The Redwood format stored depth in a 16-bit single channel image.
The integer value represents the depth measurement in millimeters. It is the default format for Open3D to parse depth images.
# src/Python/Tutorial/Basic/rgbd_redwood.py

import sys
sys.path.append("../..")

#conda install pillow matplotlib
from py3d import *
import matplotlib.pyplot as plt


if __name__ == "__main__":
    print("Read Redwood dataset")
    color_raw = read_image("../../TestData/RGBD/color/00000.jpg")
    depth_raw = read_image("../../TestData/RGBD/depth/00000.png")
    rgbd_image = create_rgbd_image_from_color_and_depth(
        color_raw, depth_raw);
    print(rgbd_image)
    plt.subplot(1, 2, 1)
    plt.title('Redwood grayscale image')
    plt.imshow(rgbd_image.color)
    plt.subplot(1, 2, 2)
    plt.title('Redwood depth image')
    plt.imshow(rgbd_image.depth)
    plt.show()
    pcd = create_point_cloud_from_rgbd_image(rgbd_image,
            PinholeCameraIntrinsic.prime_sense_default)
    # Flip it, otherwise the pointcloud will be upside down
    pcd.transform([[1, 0, 0, 0], [0, -1, 0, 0], [0, 0, -1, 0], [0, 0, 0, 1]])
    draw_geometries([pcd])
The default conversion function create_rgbd_image_from_color_and_depth creates an RGBDImage from a pair of color and depth image.
The color image is converted into a grayscale image, stored in float ranged in [0, 1].
The depth image is stored in float, representing the depth value in meters. print(rgbd_image) yields:
RGBDImage of size
Color image : 640x480, with 1 channels.
Depth image : 640x480, with 1 channels.
Use numpy.asarray to access buffer data.
Here we use PinholeCameraIntrinsic.prime_sense_default as default camera parameter.
データセット
有名所の
- Redwood dataset
- SUN dataset
- NYU dataset
- TUM dataset
のデータセットの読み込みなど丁寧な説明がある。
本当に素晴らしい。
Basic
python binding
def example_import_function():
    from py3d import read_point_cloud
    pcd = read_point_cloud("../../TestData/ICP/cloud_bin_0.pcd")
    print(pcd)
-> PointCloud with 198835 points.
以下のようにhelp()でクラスや関数の説明が見れる
def example_help_function():
    import py3d as py3d
    help(py3d)
    help(py3d.PointCloud)
    help(py3d.read_point_cloud)
Point Cloud
# src/Python/Tutorial/Basic/pointcloud.py

import sys
import numpy as np
sys.path.append("../..")
from py3d import *

if __name__ == "__main__":

    print("Load a ply point cloud, print it, and render it")
    pcd = read_point_cloud("../../TestData/fragment.ply")
    print(pcd)
    print(np.asarray(pcd.points))
    draw_geometries([pcd])

    print("Downsample the point cloud with a voxel of 0.05")
    downpcd = voxel_down_sample(pcd, voxel_size = 0.05)
    draw_geometries([downpcd])

    print("Recompute the normal of the downsampled point cloud")
    estimate_normals(downpcd, search_param = KDTreeSearchParamHybrid(
            radius = 0.1, max_nn = 30))
    draw_geometries([downpcd])
    print("")

    print("Load a polygon volume and use it to crop the original point cloud")
    vol = read_selection_polygon_volume("../../TestData/Crop/cropped.json")
    chair = vol.crop_point_cloud(pcd)
    draw_geometries([chair])
    print("")

    print("Paint chair")
    chair.paint_uniform_color([1, 0.706, 0])
    draw_geometries([chair])
    print("")
読込
pcdデータなど一行で読み込める
read_point_cloud reads a point cloud from a file. It tries to decode the file based on the extension name.
The supported extension names are: pcd, ply, xyz, xyzrgb, xyzn, pts.
表示
表示ももちろん一行笑
draw_geometries visualizes the point cloud. Use mouse/trackpad to see the geometry from different view point.

操作方法
-- Mouse view control --
  Left button + drag        : Rotate.
  Ctrl + left button + drag : Translate.
  Wheel                     : Zoom in/out.

-- Keyboard view control --
  [/]          : Increase/decrease field of view.
  R            : Reset view point.
  Ctrl/Cmd + C : Copy current view status into the clipboard.
  Ctrl/Cmd + V : Paste view status from clipboard.

-- General control --
  Q, Esc       : Exit window.
  H            : Print help message.
  P, PrtScn    : Take a screen capture.
  D            : Take a depth capture.
  O            : Take a capture of current rendering settings.
:
アニメーションもつくれるみたい
In addition to draw_geometries, Open3D has a set of sibling functions with more advanced functionality. draw_geometries_with_custom_animation allows the programmer to define a custom view trajectory and play an animation in the GUI. draw_geometries_with_animation_callback and draw_geometries_with_key_callback accept Python callback functions as input. The callback function is called in an automatic animation loop, or upon a key press event. See Customized visualization for details.
Customized visualization — Open3D 0.9.0 documentation
ダウンサンプリング
まさかのダウンサンプリングも一行驚
print("Downsample the point cloud with a voxel of 0.05")
downpcd = voxel_down_sample(pcd, voxel_size = 0.05)
draw_geometries([downpcd])

Vertex normal estimation
print("Recompute the normal of the downsampled point cloud")
estimate_normals(downpcd, search_param = KDTreeSearchParamHybrid(
        radius = 0.1, max_nn = 30))
draw_geometries([downpcd])
print("")

画面上で"n", "+", "-"で法線の操作が可能
estimate_normals computes normal for every point. The function finds adjacent points and calculate the principal axis of the adjacent points using covariance analysis.
The function takes an instance of KDTreeSearchParamHybrid class as an argument. The two key arguments radius = 0.1 and max_nn = 30 specifies search radius and maximum nearest neighbor. It has 10cm of search radius, and only considers up to 30 neighbors to save computation time.
KDtree: kd木 - Wikipedia
Crop point cloud
print("We load a polygon volume and use it to crop the original point cloud")
vol = read_selection_polygon_volume("../../TestData/Crop/cropped.json")
chair = vol.crop_point_cloud(pcd)
draw_geometries([chair])
print("")

Paint Point Cloud
print("Paint chair")
chair.paint_uniform_color([1, 0.706, 0])
draw_geometries([chair])
print("")

コツコツ使い方を覚えてPoint Cloudを自由に扱えるようになりたい〜